What is Google analytics?
A big part of your company's success depends on analytics. If you don't know what these are, or how they work, it can be a huge headache in the making. But if you do your research and pick the right tool, you'll get to see who is visiting your website and where they're coming from,
What kind of content people like to read, which posts are driving the most traffic and engagement. You'll have a great insight into your customers, giving you all the knowledge needed to start optimizing your marketing campaigns, knowing which content to create and how to attract more visitors.
Google analytics is a set of practices and technologies used to monitor and analyze data to find trends, measure the effectiveness of campaigns, and make better business decisions. For example, a website might use analytics for the following:

1. To measure the success of certain ad campaigns.
2. To find out what content is best for their site and who is reading it so they can make more of it.
3. Answer questions about what their users want and how to get them to convert.
4. To predict what kind of content is going to make them the most money.
There are many different kinds of analytics in the world and they all have their own purpose, but they all have one thing in common: they’re used to learn more about your visitors, as well as your product or service. It’s very important to know how someone uses a site if you want your product or service to be the best.
Understanding the Basics of Google Analytics
Google Analytics is a great tool for understanding your visitors and what they want, but it can be very confusing at first. Understanding your reports will help you utilize the tool more effectively and get more out of it.

1. Organization:
Google Analytics is an integrated package. It comes with a set of reports and tools that you can use to measure your data. But it’s not just an analytics package. It also has powerful functionality to help you track your campaigns and your performance.
2. Goals:
Goals are simple, but very powerful. They help you get a better understanding of what people want from you and how they’re engaging with your content, which can help determine how to create the best possible content for them.
3. Goals and Reports:
Google Analytics has a variety of goals, from Bounces to Conversions, but it also comes with a number of reports you can use to help you understand and track your performance. There are over 100 different reports and numbers you can use to measure your performance.

4. User Acquisition:
This report will show you where people are coming from so that you can keep improving the content of your website, whether that be by tracking the best keywords in which people are coming from or creating more valuable content for them.
5. Content Performance:
This report will show you how your content is performing, so that you know if your visitors are reading the most popular videos or the most popular blog posts. You can also see which pages and images are getting the most views.
6. Site Structure:
This report will allow you to look at your site structure and see what pages users are visiting and when they’re visiting them. They can help you determine how to make more useful pages for your visitors
How to Set Up Google Analytics?
Before you start using Google Analytics, you’ll need to head over to the Google Analytics website and click on the big button that says “Free”. This will take you through a few steps where you can sign up for a new account, or log in with an existing one. Once logged in, click on the “Admin” tab to get started.
Learn From OCP Academy DIGITAL MARKETING INTEGRATED SIMULATION & CERTIFICATION PROGRAM , You will get real time projects here
How To Get Started With Google Analytics?
Step 1- Add a Property
If you have several sites, you’ll need to create a property for each one. A property is like an account for your site, but it’s just an easier way to keep track of everything. Click on “New Property”.
Step 2- Create Your Property
Once in the “Create new property” page, you’ll be asked to choose a default language and whether or not you want this to be for a website or mobile app. If you choose a website, you can enter information like your domain name, website address (URL), and public-facing IP address. For the IP address, Enter the address of your Property or Account to monitor.
Step 3- Set Up Goals
Goals are just statistics about each property that you create. Once you get them set up, they’ll give you a list of the properties and their corresponding metadata, like “Session duration”, “Session length”, “No. Unique Sessions” etc., which can help you improve your site.
Step 4- Save Your Property
Once everything is saved correctly, click on “Save”.
Google Analytics Reports
Before using Google Analytics, I suggest taking a look at the Analytics Training to learn more about Google Analytics essentials like goals and reports. This will help you get started the right way-
1. Google Analytics Real-Time Report
This report is great for seeing how many people are on your website. It also allows you see who is on your site and where they’re coming from, using Google Analytics Audience Insights. This can help you understand your audience better and help you predict what kind of content they want to see.
2. Media Report
Media Report is a good way to see how your content is doing and where it’s getting the most attention. When you’re looking at reports like these, you’ll need to do some investigating first. Since there’s a lot of information, it may help to break it down before you start studying the data. The Google Analytics report has the following columns: “Rank”, “Impressions”, “Views”, “Position”.
3. Acquisition Report
This report will show you where people are coming from, which can be very helpful if you’re trying to make more of that same content. It will also allow you to see where your website is ranking in the search engines. You’ll need to add a date range, which will then list out your top traffic sources and how they’ve been performing throughout the period you selected. Here’s a breakdown of what each column means: “source”, “medium”, “campaign”, and “keyword”.
4. Google Analytics Audience Report
With the Audience report you’ll be able to see how many people are coming to your site, based on a number of different demographics. It’s not your typical demographics, like age, gender and education. Those are great statistics to know, but Google Analytics has done something a little different.
They offer “Audience reporting”, which allows you to focus on people who have the potential to buy from you. You can filter by things like: “All users”, “New visitors”, “Returning visitors” and “Mobile App Users”. Some of the demographics that you can find in this report include: “Gender”, “Age”, “Overall Experience Level”, “Device Type” and “User Region”.
DIGITAL MARKETING INTEGRATED SIMULATION & CERTIFICATION PROGRAM
Related Resource
Offline VS Online Advanced Digital Marketing Courses: Which is better?
Who Can Do Digital Marketing: Open Opportunities for All
Why are Digital Marketing Courses essential for today’s professionals?
Benefits of Hands-On Experience in Digital Marketing Courses
How to Choose the Best Digital Marketing Course in Patna Bihar
How to do Digital Marketing: A Comprehensive Guide
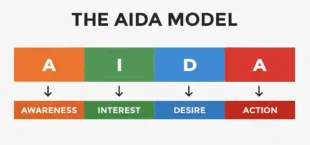
From Attention to Action: A Comprehensive Guide to AIDA
July 14 Marks a New Chapter: Chandrayaan-3's Journey to the Moon Begins
Recent Posts
- Offline VS Online Advanced Digital Marketing Courses: Which is better?
- Who Can Do Digital Marketing: Open Opportunities for All
- Why are Digital Marketing Courses essential for today’s professionals?
- Benefits of Hands-On Experience in Digital Marketing Courses
- How to Choose the Best Digital Marketing Course in Patna Bihar
Archives
Categories
- AdTech & MarTech EcoSystem
- Artificial Intelligence
- Brand Digital Presence & Optimization
- Career In Digital Marketing
- Chandrayaan
- ChatGPT
- Content Marketing
- Customer Journey
- Data Science
- Digital Marketing
- Digital Marketing Foundation
- Digital Marketing Freelancing Business
- Display Marketing
- E-Commerce Management
- Effective Email Marketing
- Emerging Technologies for Digital Marketing
- Freelancing
- Fundamentals of Social Media
- Future of Digital Marketing
- Impact of COVID-19
- JOB
- Mobile App Marketing
- OCP Academy
- Off-Site SEO
- On-Site SEO
- Online Advertising
- PPC Ads
- Search Engine Marketing
- Search Engine Optimization
- Social Media
- Space Science
- The Path to Digital Journey
- Uncategorized
- Web Design


